Droplet Revenue assurance for finance and RevOps teams.
A product website and dashboard for a revenue assurance tool that checks contracts, usage, billing and payments to find underbilling and missed revenue.
At a glance
- Type
- Website + dashboard UI
- Role
- Website and product UI design
- Tools
- Figma, Next.js, Cloudflare
- Tags
- SaaSFinanceWebsite DesignDashboard UI
- Deliverables
- Marketing websiteProduct dashboard interfacePricing and plan comparison
- Services used
- Business websitesProducts and dashboards
Overview
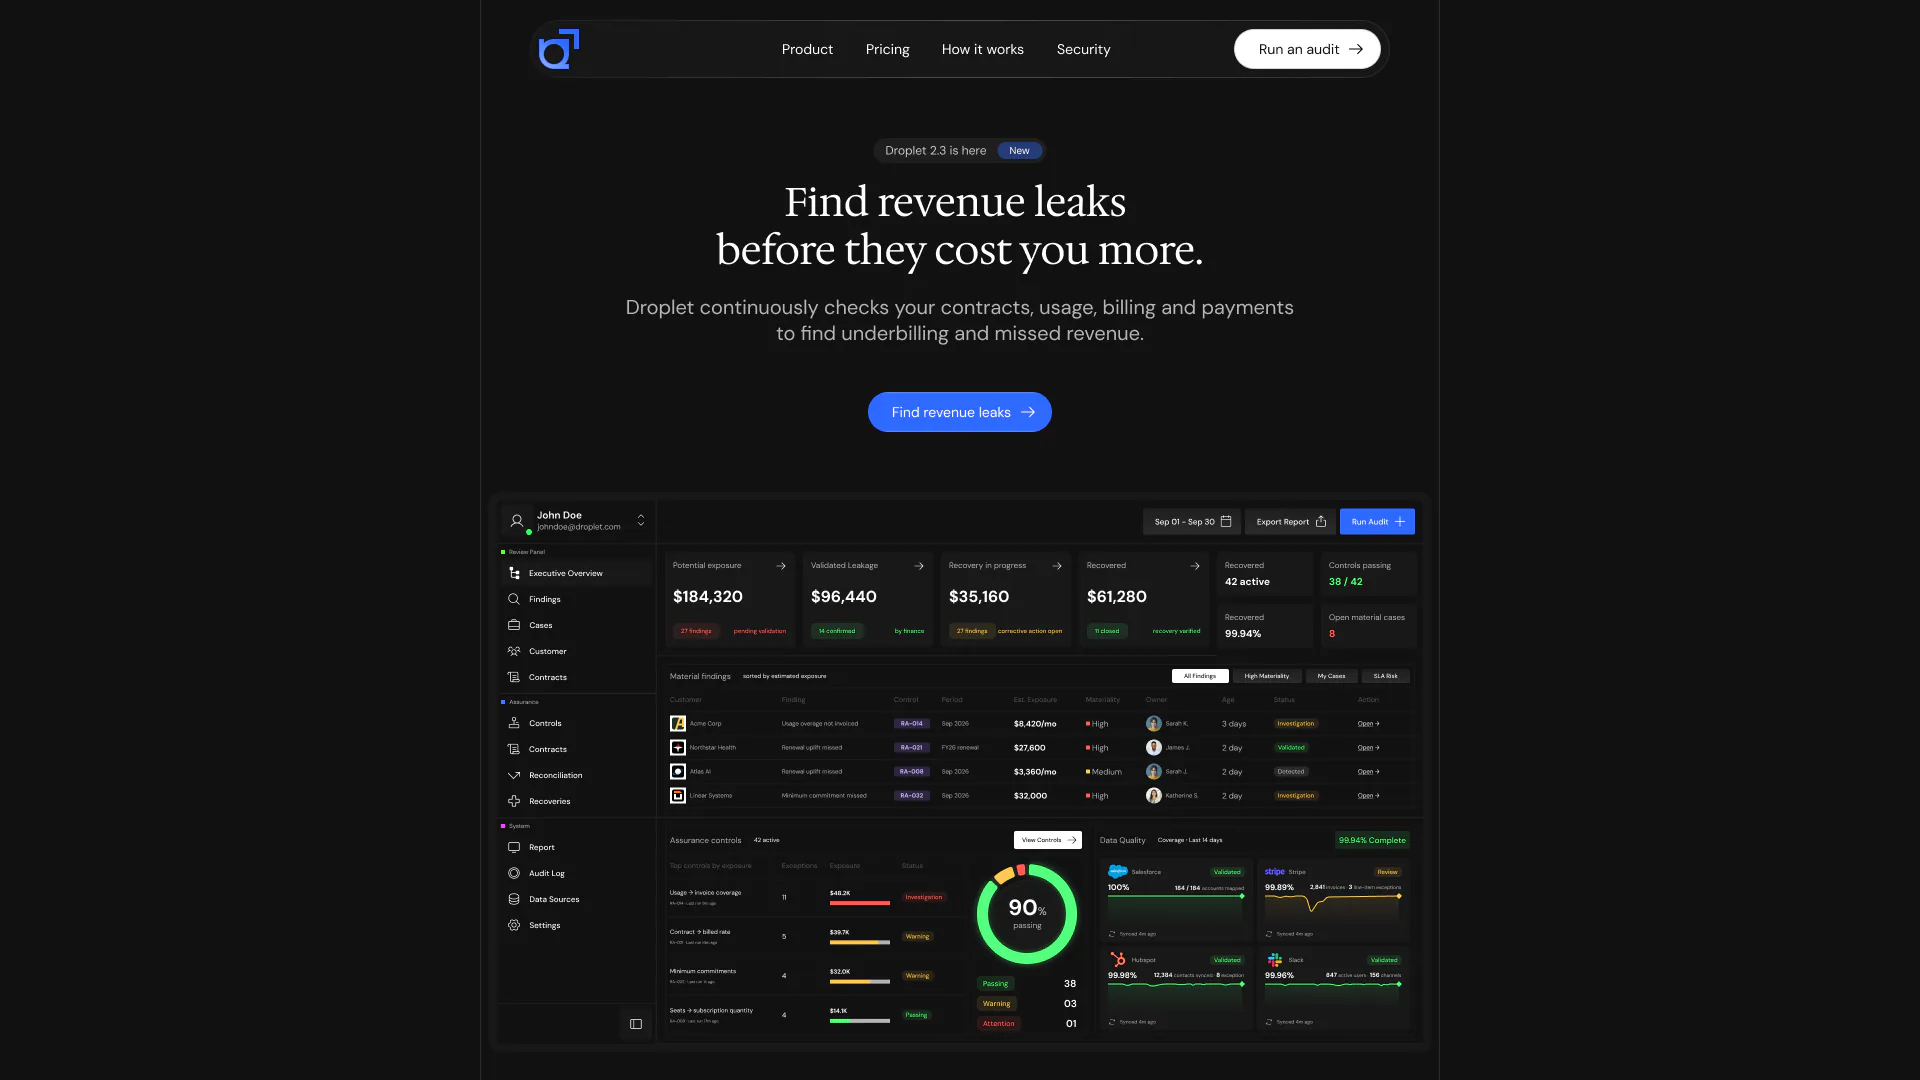
Droplet is a revenue assurance tool for finance and RevOps teams. It compares what customers should pay under their contracts with what they were actually billed, and flags the gaps. That gives the product two jobs on screen: a website that has to make an abstract problem, revenue leaks, easy to grasp in a few seconds, and a dashboard that has to turn raw billing data into something a team can act on.
This project covers both. The website leads with a single promise, "Find revenue leaks before they cost you more", with one action and the product itself directly underneath. The dashboard follows the money from how much is at risk to how much has been recovered.
Key decisions
Key design decisions
Website
The product is on the first screen
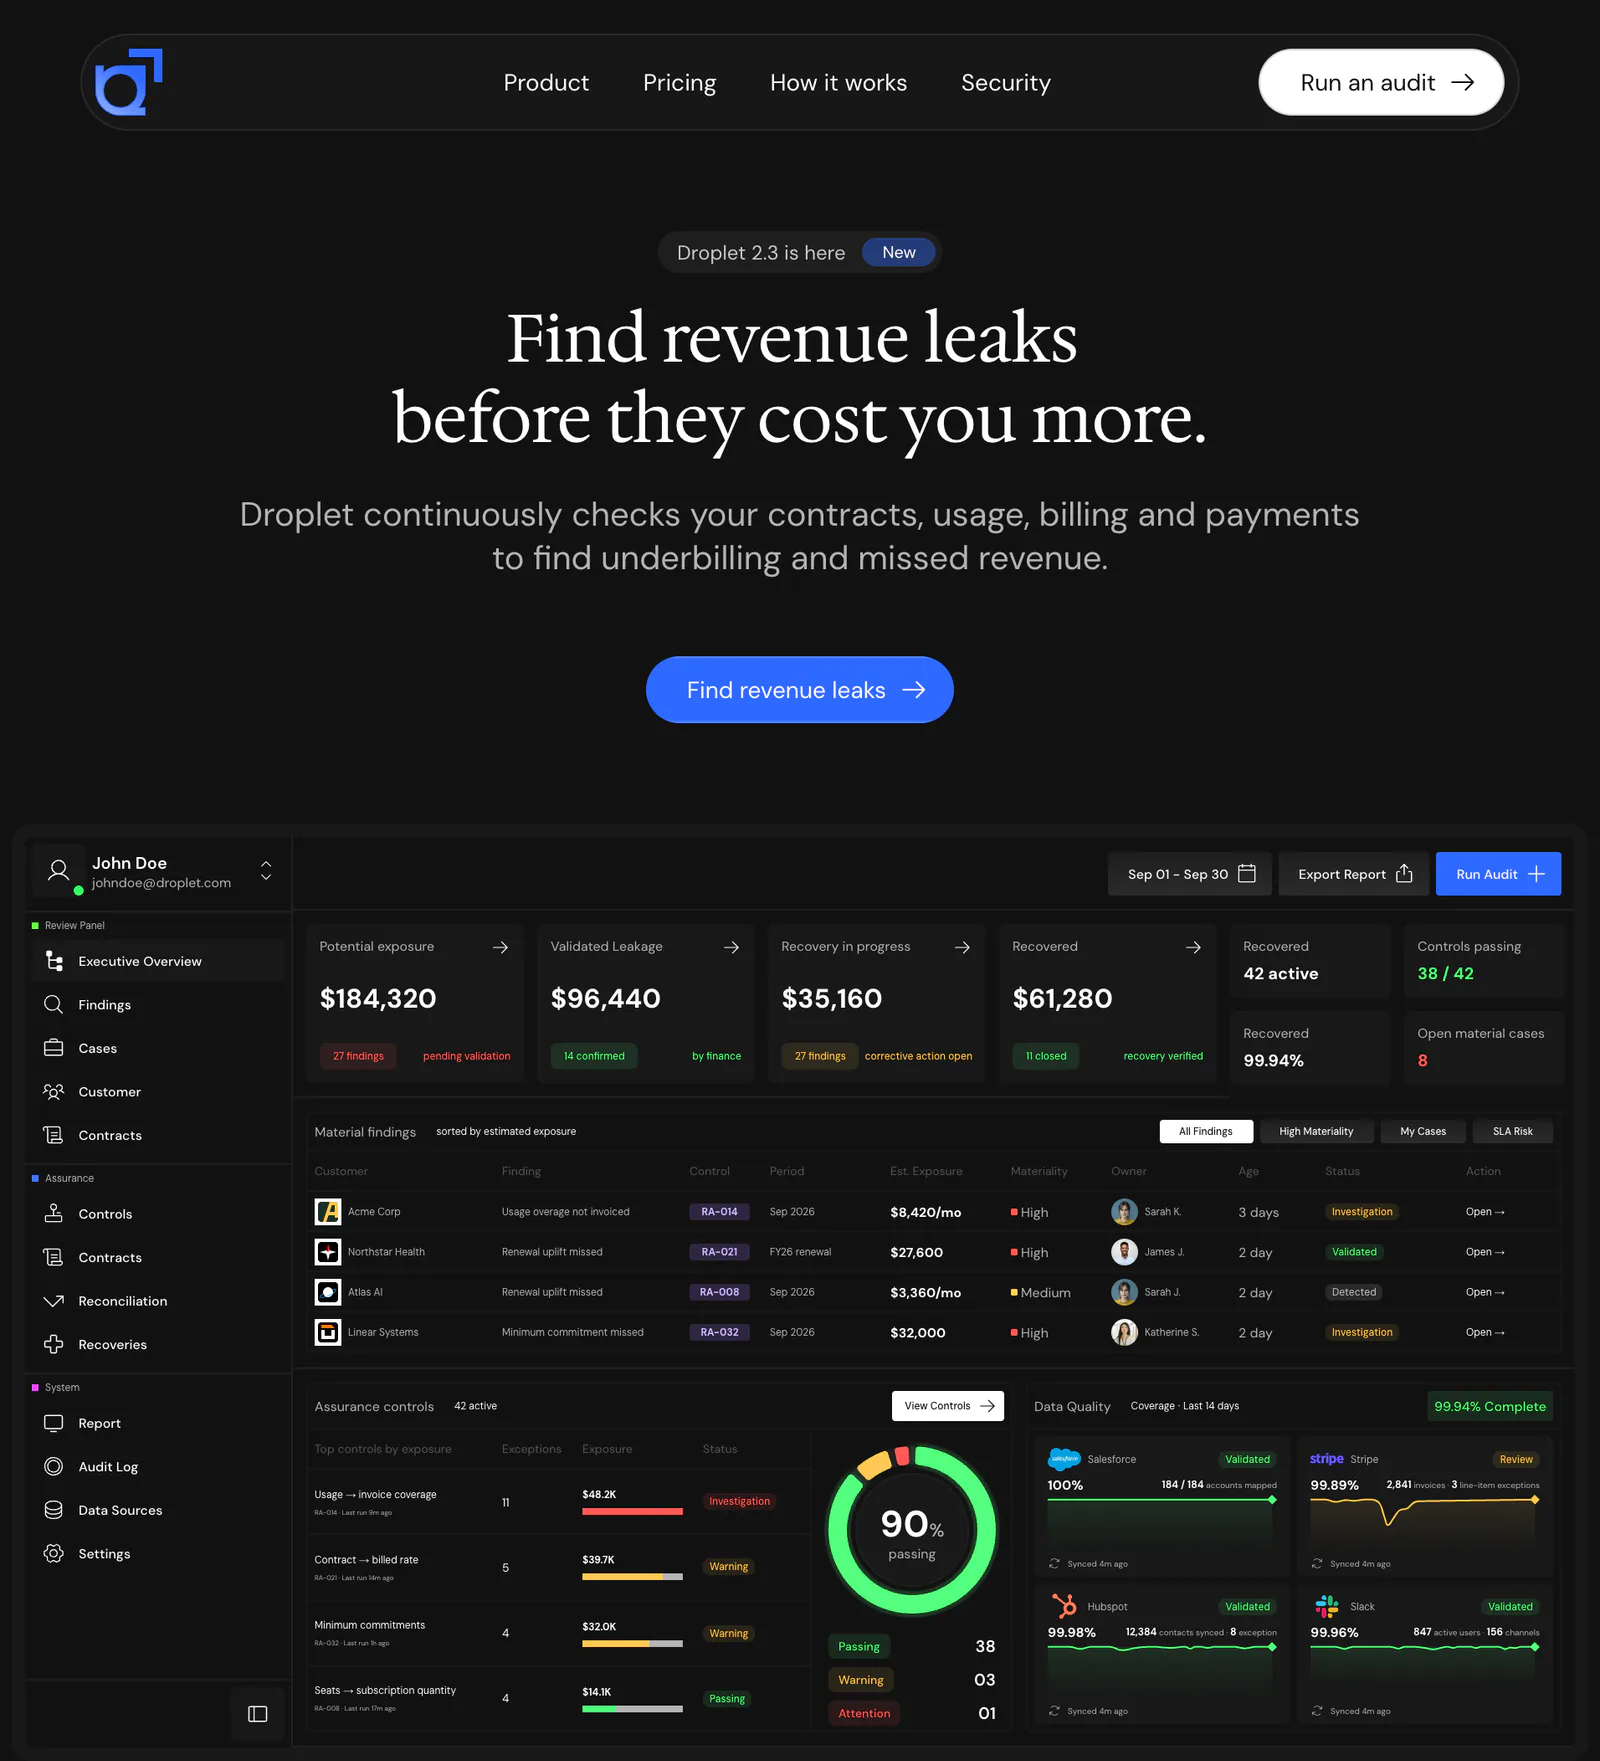
The hero states the promise, offers one action and shows the dashboard directly underneath, so a visitor sees what the product does before they scroll.
Website
How it works, shown rather than described
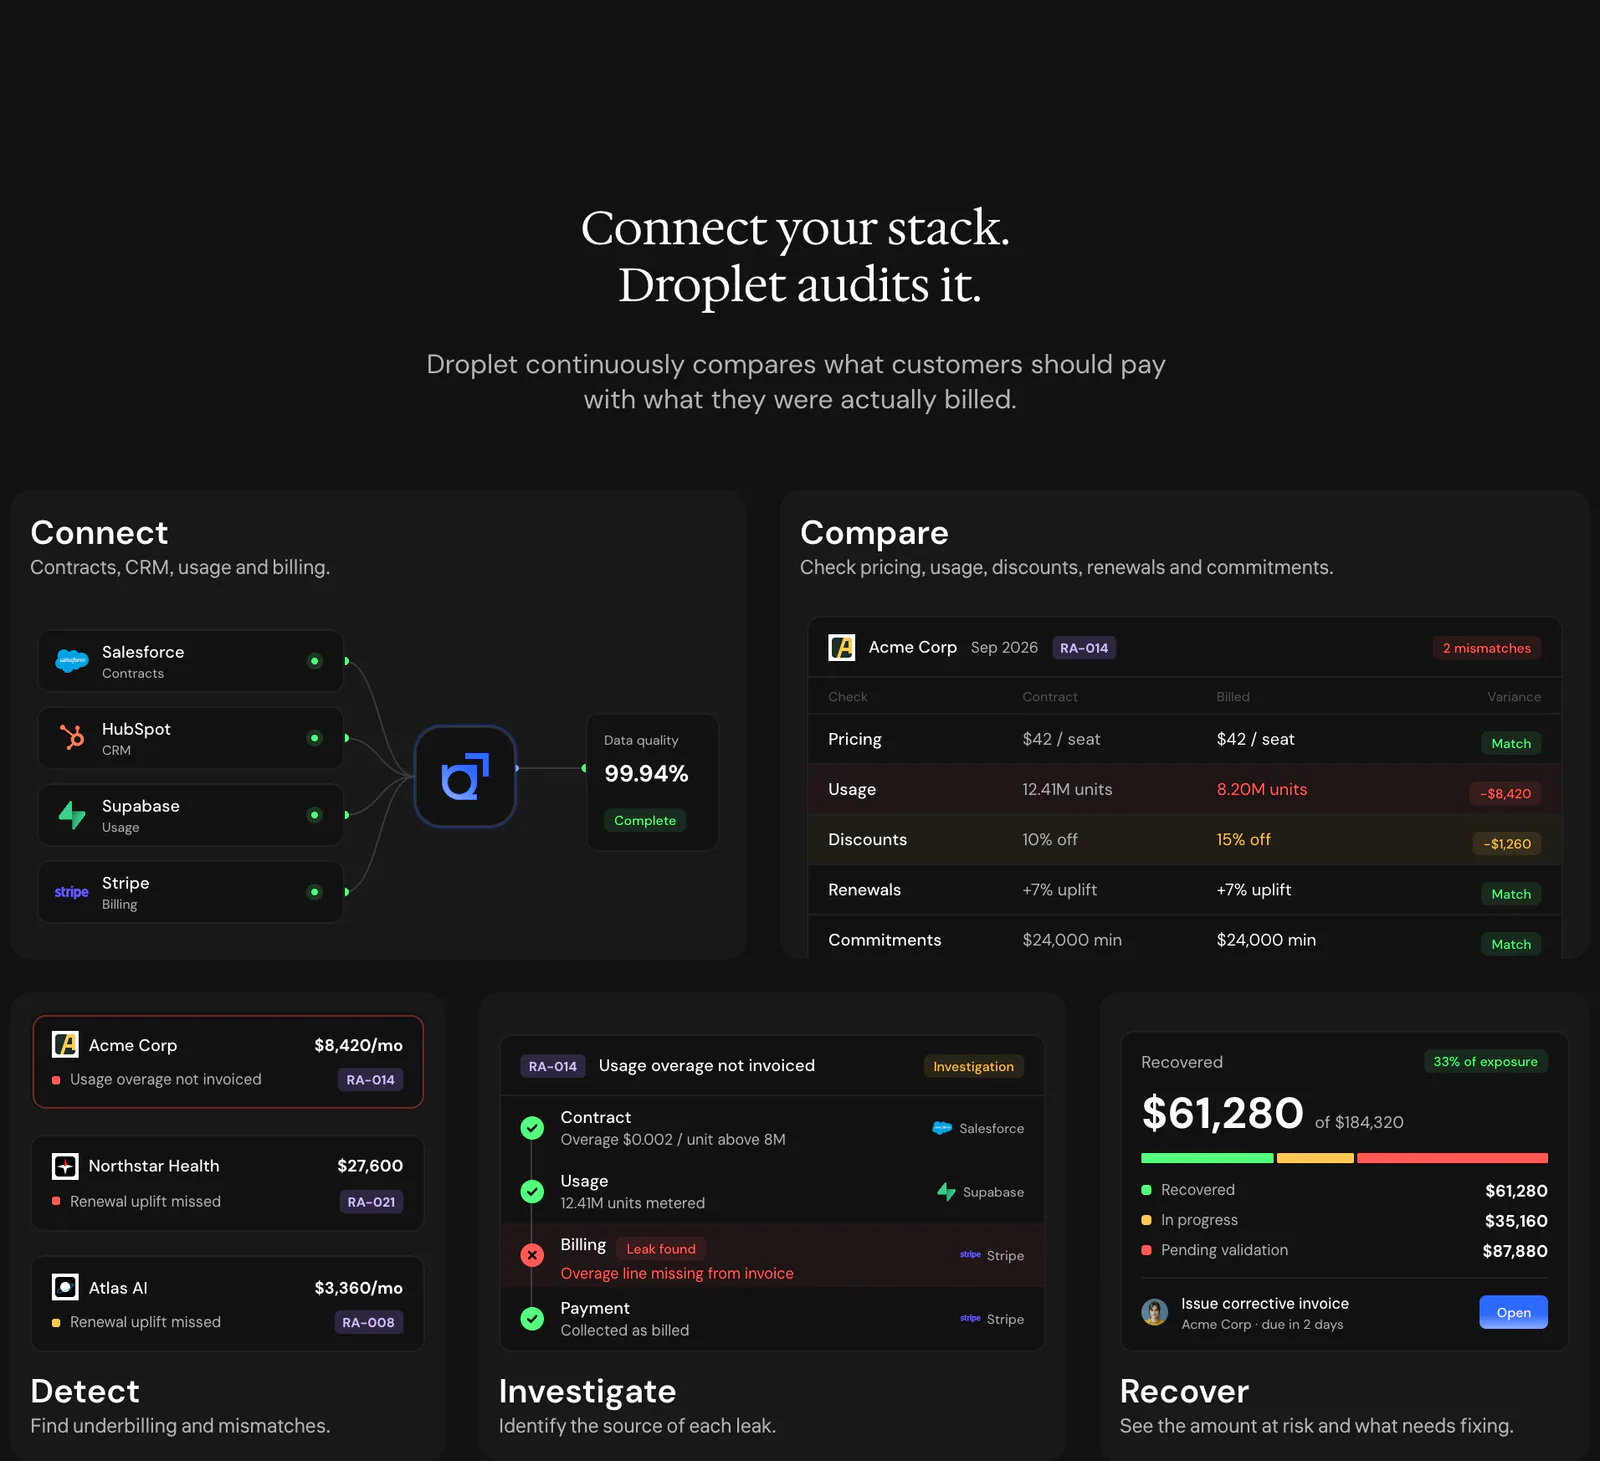
Five steps (connect, compare, detect, investigate and recover) are each paired with a small piece of the real interface, so the explanation is the product rather than an illustration of it.
Website
Plans that compare at a glance
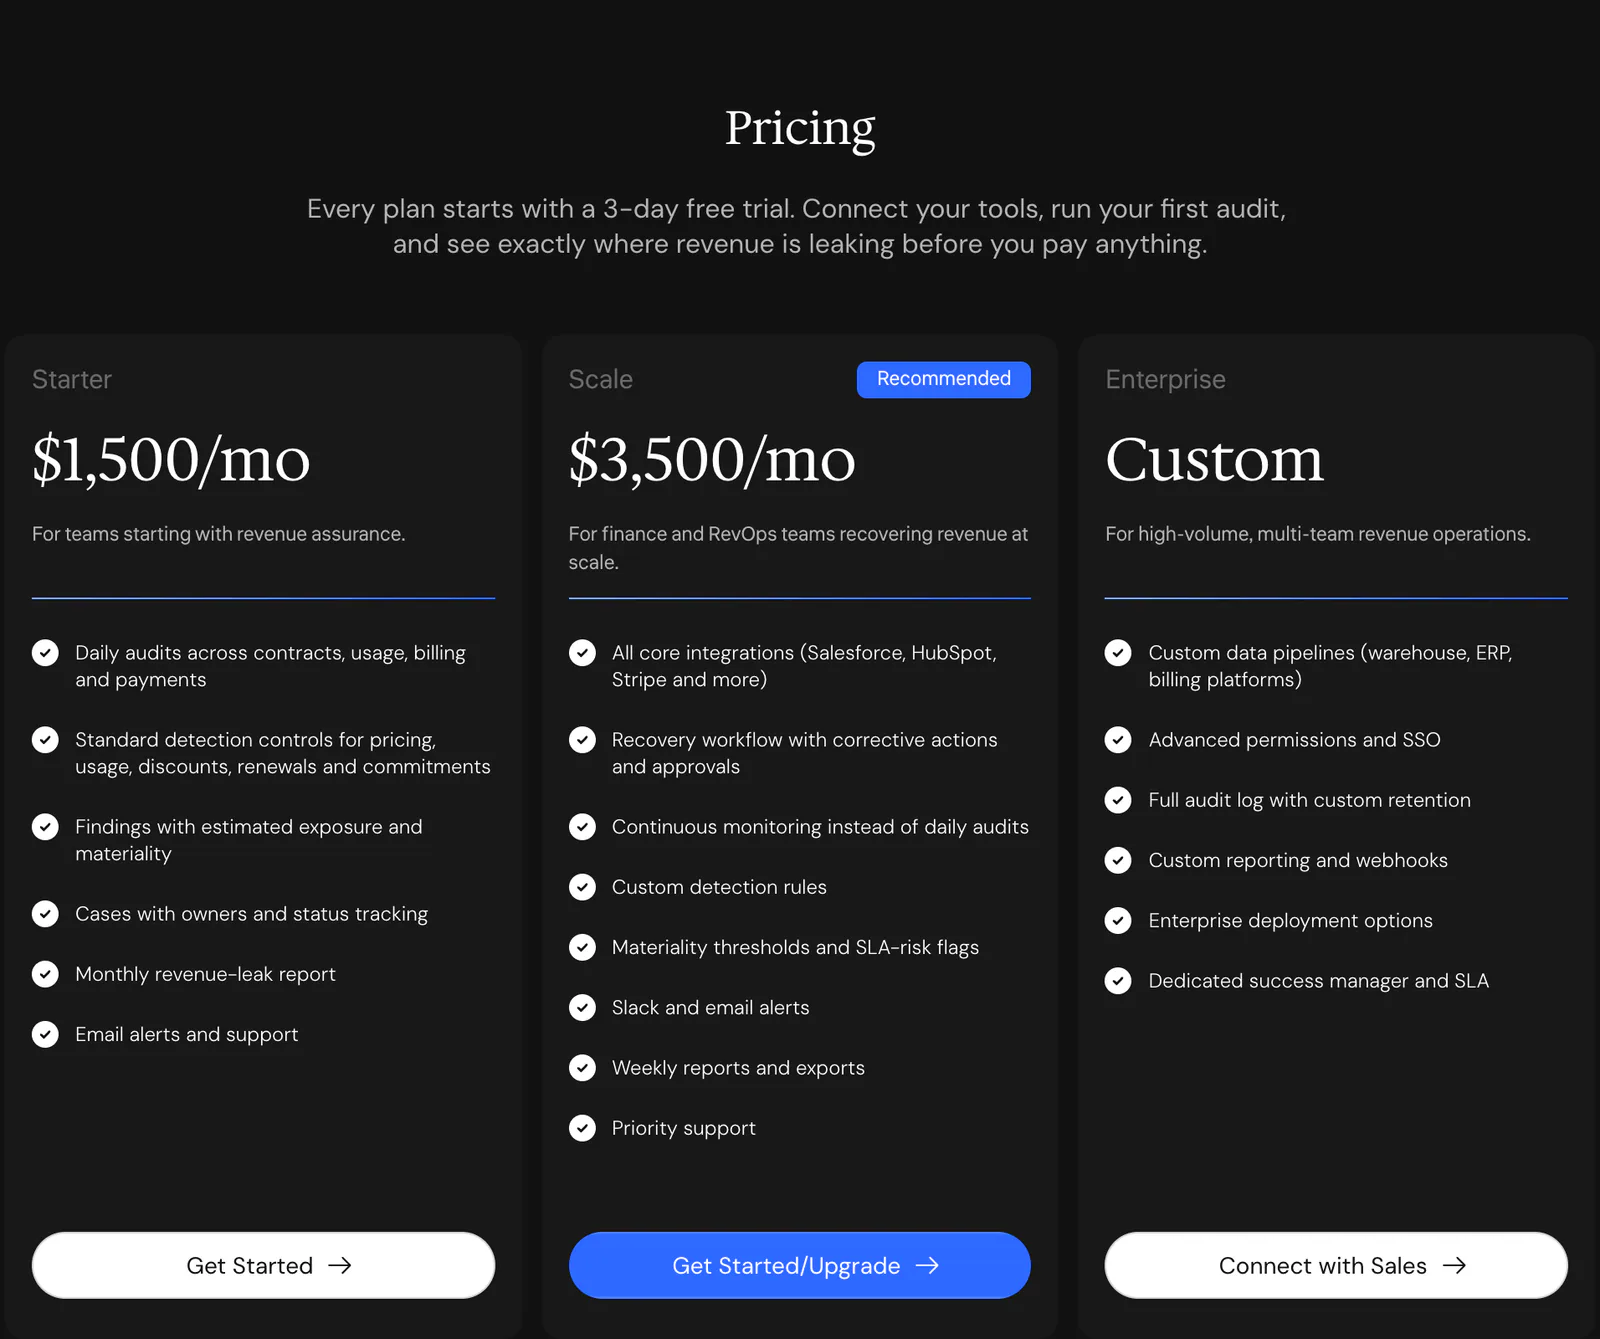
Three plans sit side by side with one marked Recommended, followed by a comparison table grouped into coverage, detection, recovery, and security and support.
Dashboard
Four numbers follow the money
The overview opens on potential exposure, validated leakage, recovery in progress and recovered, in that order, each with a short status such as pending validation or recovery verified.
Dashboard
Findings sorted by what they cost
The findings table is sorted by estimated exposure and puts the control, period, materiality, owner, age and status on one row, with filters for high materiality, my cases and SLA risk.
Dashboard
Colour that carries meaning
On a dark interface, green marks what passes or is recovered, amber what is in progress or needs a look, and red what needs attention, so a row can be read without reading its label.
Screens
Selected screens
What shipped
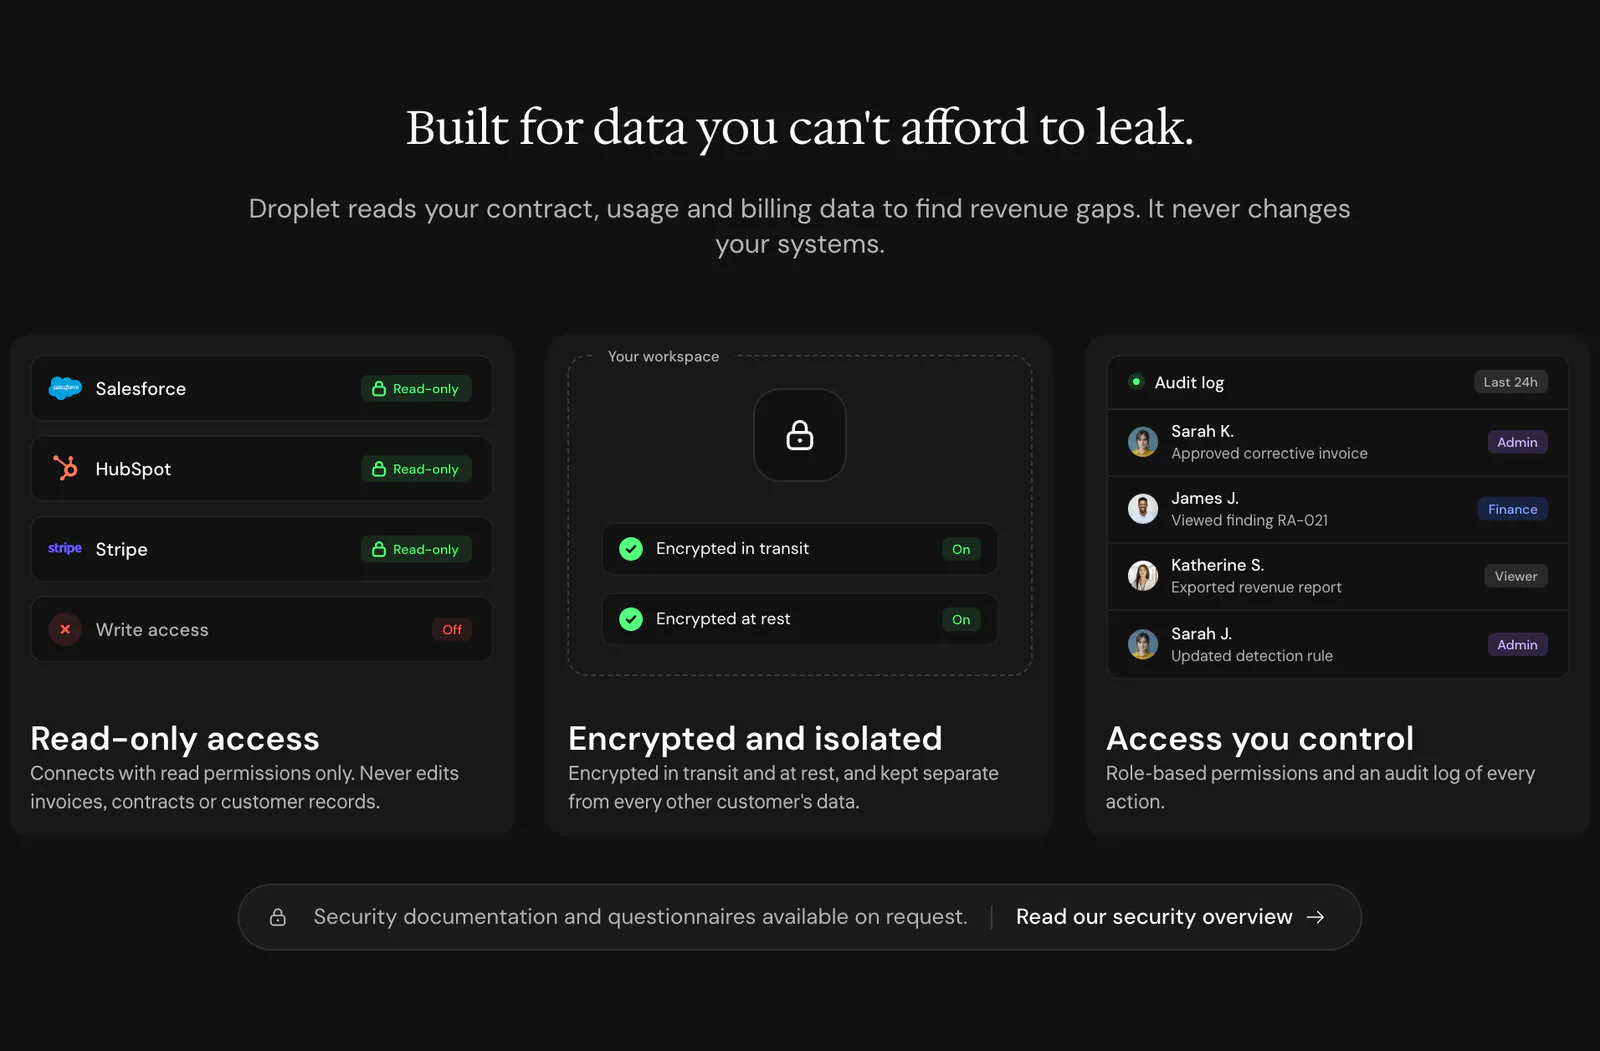
- A product websiteHero, how it works, integrations, pricing with a plan comparison, security, FAQ and a closing call to action. Live at droplet.guppie.workers.dev.
- An executive dashboard interfaceOverview, material findings, assurance controls and data quality, shown in the hero and across the how-it-works cards.